
Measuring Content Marketing ROI A Practical Guide
Published on 2025-11-27
Everyone knows the basic content marketing ROI formula: (Net Profit / Total Investment) x 100. But let's be honest, the math is the easy part. The real work—the part that separates a genuine return from a bunch of vanity metrics—is figuring out what to measure and how to track it correctly.
Likes and shares are nice, but they don't pay the bills. If you want to prove your content's worth, you have to connect it to real business results.
First Things First: Laying the Groundwork for ROI Measurement
Before you can even think about calculating ROI, you need a solid foundation. This means defining what success actually is for your business. You have to move past surface-level engagement and draw a clear line from every blog post, case study, and video to a tangible business outcome. Without that connection, you’re just tracking numbers in a vacuum.
The very first step is to make sure your content goals are locked in with your company’s big-picture objectives. Are you trying to steal market share? Lower your customer acquisition costs? Keep existing customers happy and paying? Whatever the C-suite cares about, that’s what your content should be working toward.
For example, let's say a B2B SaaS company wants to land more enterprise clients. A great content goal would be to increase qualified demo requests from organic search by 15% this quarter. See? It's specific, measurable, and tied directly to a business priority.
Turning Business Goals into Content KPIs
Once you have that main business objective, you can break it down into specific Key Performance Indicators (KPIs) for your content. This is how you give every piece of content a job. I like to think of my content assets as a team of employees—each one needs a clear role and a way to tell if it's doing its job well.
A good way to organize this is by mapping your KPIs to the different stages of the buyer's journey.
Top of Funnel (Awareness): The goal here is simple: attract new people and introduce them to your brand. These KPIs aren't directly about revenue, but they're crucial leading indicators. You'll want to track things like organic keyword rankings, traffic from new users, and how many new backlinks you're earning.
Middle of Funnel (Consideration): At this point, your audience is actively looking for solutions. Your content needs to build trust and show them you're the expert. Here, you should be measuring KPIs like email newsletter sign-ups, downloads of gated content (like whitepapers or ebooks), and webinar registrations.
Bottom of Funnel (Decision): This is where the magic happens—turning prospects into paying customers. The KPIs here are all about the money. Track demo requests, free trial sign-ups, consultation bookings, and, of course, actual sales that came from your content.
My Two Cents: Don't treat all your content the same. A top-of-funnel blog post is there to bring in traffic. A bottom-of-funnel case study is there to close a deal. You have to measure them against their specific jobs.
Let's Make This Real: A Practical Example
Imagine you're running marketing for a LinkedIn outreach tool, something like Unibox. The main business goal is to grow Monthly Recurring Revenue (MRR). So how does that translate into a content plan with clear KPIs?
You might create a blog post titled "10 LinkedIn Cold Message Templates That Actually Get Replies." This is a classic top-of-funnel piece. Its job isn't to sell directly, but to attract the right people. Its primary KPIs would be:
- Rank in the top 3 for its target keyword within six months.
- Bring in 2,000 new organic visitors every month.
- Get 50 new email subscribers through a content upgrade.
On the other hand, a case study showing how a sales team doubled their meetings with Unibox is a bottom-of-funnel powerhouse. Its KPIs look very different:
- Generate 25 demo requests per quarter from people who read it.
- Achieve a 10% lead-to-customer conversion rate from those demos.
When you get this specific, you stop guessing and start building a predictable growth engine. You've given every asset a clear purpose and a measurable outcome, which means you can confidently double down on what works and fix what doesn't. This foundational work is absolutely the most important part of measuring content ROI. If you want to go deeper on this, check out our complete guide on how to measure content performance.
Getting Your Tracking and Attribution in Order
Okay, so you’ve got your goals and KPIs locked in. Now comes the real work: building the technical plumbing that connects your content to actual business results. This is where we stop guessing and start proving.
We're going to set up a system that follows a user from their first click on a LinkedIn post all the way to a closed deal in your CRM. Without this foundational work, any talk about ROI is just wishful thinking. You need to be able to trace every piece of content back to a tangible outcome to show its true impact.
The whole idea is to have a clear line of sight from your big-picture business goals down to the specific metrics you track, like this:
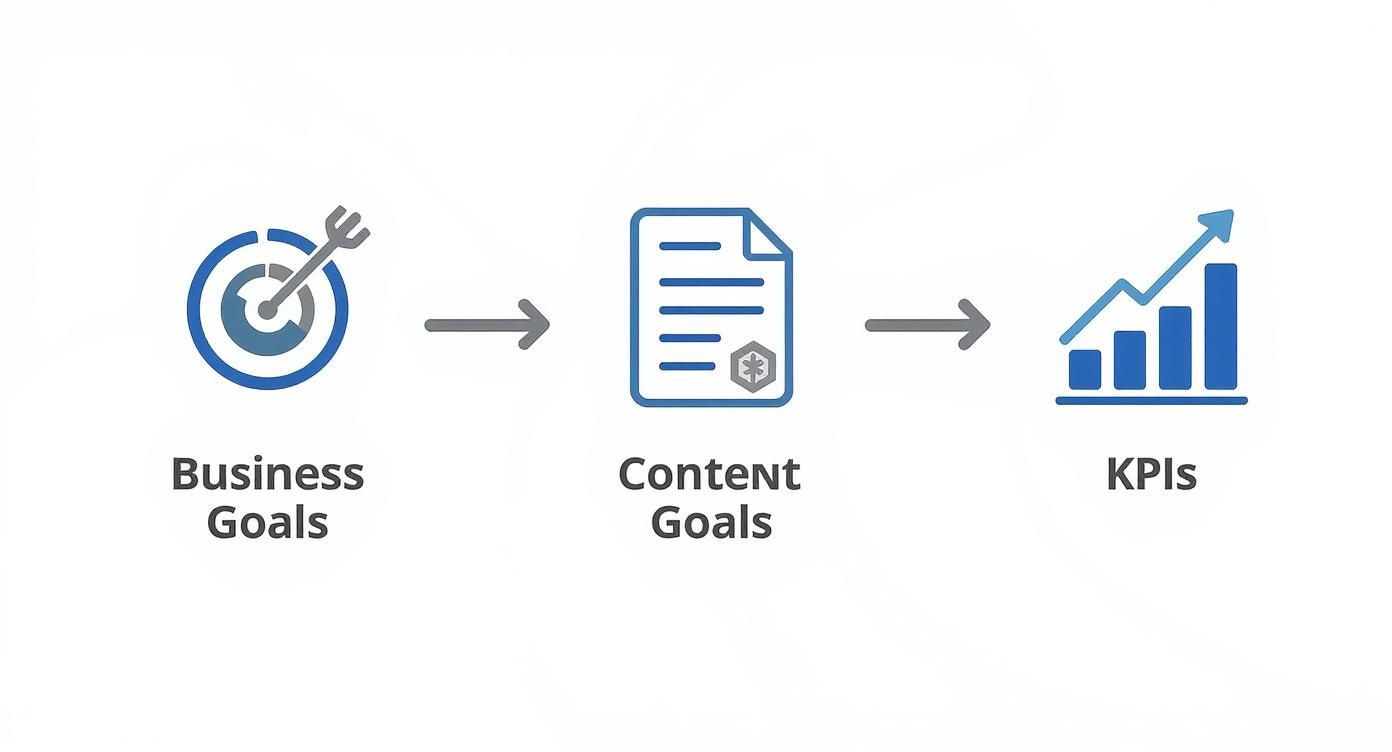
When your analytics setup is built with this kind of purpose, every piece of data tells a story.
Master UTMs to Get Crystal-Clear Attribution
If there’s one non-negotiable for accurate tracking, it’s using UTM parameters. These are just simple tags you add to the end of a URL, but they’re incredibly powerful. They tell your analytics exactly where a visitor came from.
Skipping them is a huge mistake. Without UTMs, all your hard work gets dumped into vague buckets like "social" or "direct," leaving you blind to what’s actually working. Is it that LinkedIn ad? The link in your company bio? That specific organic post? UTMs give you the answer.
You can easily build these with Google's free Campaign URL Builder.
For example, let's say you're sharing a new blog post on LinkedIn. Your URL tags might look something like this:
- utm_source=linkedin (This tells you the visitor came from LinkedIn)
- utm_medium=social_organic (This specifies it was from an unpaid social post)
- utm_campaign=q3_ebook_launch (This groups all activities related to your Q3 ebook launch)
My biggest pro-tip: Create a shared spreadsheet for your team with standardized UTM naming conventions. Trust me, it saves you from a massive headache later when you're trying to analyze messy, inconsistent data.
To make it even easier, here’s a quick reference guide for your team to use.
Essential UTM Parameter Cheat Sheet
This cheat sheet will help you and your team create consistent and effective UTM parameters for every campaign.
| Parameter | Purpose | Example Usage |
|---|---|---|
| utm_source | Identifies the platform or referrer. | utm_source=linkedin |
| utm_medium | Identifies the marketing medium. | utm_medium=social_organic |
| utm_campaign | Names the specific campaign or promotion. | utm_campaign=q4_webinar |
| utm_content | Differentiates links within the same ad/post. | utm_content=image_link |
| utm_term | Identifies paid search keywords. | utm_term=content_roi_software |
Keeping these consistent across the board is the key to clean, reliable data you can actually use to make decisions.
Define What a "Win" Looks Like in Google Analytics 4
Once you have tagged traffic flowing to your site, you need to tell your analytics platform which actions actually matter. In Google Analytics 4 (GA4), these are called conversions. A conversion is simply any user action that you've decided is valuable—an action that aligns directly with the KPIs you set earlier.
Think of it as translating user behavior into business value.
For most content marketers, the key conversions to track are things like:
- Form Submissions: A user requesting a demo or contacting your sales team.
- Gated Content Downloads: Someone giving you their email in exchange for an ebook.
- Newsletter Sign-ups: A clear signal they want to hear more from you.
- Free Trial Starts: A huge bottom-of-funnel action, especially for SaaS.
Every time a user lands on your site from a UTM-tagged link and completes one of these actions, GA4 makes a note of it. This creates the first critical connection between a specific piece of your content and a valuable outcome. Making this work seamlessly often depends on having the right content marketing tools available in your stack.
Connect to Your CRM for the Full Picture
This is the final, and most important, piece of the puzzle: connecting your analytics and website forms to your Customer Relationship Management (CRM) system like HubSpot or Salesforce. This is what gives you a complete view of the customer journey, from their first interaction with your content all the way to revenue.
Here’s how it works: when a user fills out a form on your site, hidden fields automatically capture their UTM data. That information then gets passed right into your CRM along with their name and email.
Suddenly, your sales team doesn't just see a new lead. They see that "Jane Doe from Acme Corp" came from your q3_ebook_launch campaign on LinkedIn. When that deal is eventually marked "Closed-Won," you can attribute that revenue directly back to the content that started the conversation.
You're no longer just tracking leads; you're tracking dollars.
This is what allows you to walk into a meeting and say, "Our LinkedIn content strategy generated $50,000 in new business last quarter." That's the kind of data that proves your value and gets budgets approved. It’s why channels like email marketing, which generate an average return of $42 for every $1 spent, are so powerful—their closed-loop nature makes this kind of direct attribution second nature.
Tallying Up the Real Costs and Returns of Your Content
To get a real, honest-to-goodness ROI number, you have to be brutally honest about both sides of the coin: what you're actually spending and what you're actually earning. It means digging deeper than just surface-level costs and putting a credible dollar value on your conversions. This is how you stop guessing and start knowing.

Uncovering Your Total Content Investment
The single biggest mistake I see companies make is thinking the cost of content is just the writer's invoice. That’s a surefire way to get a wildly inflated ROI that doesn't reflect reality. To get the true picture, you have to account for everything.
Your total content cost is the sum of every single direct and indirect expense that goes into creating and promoting a piece of content.
Content Costs You're Probably Forgetting:
- Team Time: It's not just the content creator. You need to factor in a percentage of the time spent by editors, project managers, designers, and strategists. Their input has a cost.
- Software and Tools: Add up the subscriptions for your tech stack. We're talking SEO tools like Ahrefs or Semrush, analytics platforms, design software like Canva or Adobe Creative Cloud, and project management systems.
- Freelance and Agency Fees: This one's more obvious, but make sure you're tracking every dollar spent on external help for writing, design, video, or strategy.
- Paid Promotion: Don't let your ad spend slip through the cracks. Any budget for social media ads, search ads, or influencer campaigns used to get eyes on your content belongs here.
When you start adding these up, the numbers change. A blog post isn't just the $500 you paid a freelancer. It's $500 for the writer, plus $100 in design assets, $50 in promotional spend, and $150 of your content manager’s time for planning and editing. Suddenly, the true cost is $800.
Pro-Tip: I keep a simple spreadsheet to track the costs tied to each major content asset. It might feel like a pain at first, but this level of detail is a game-changer for calculating ROI on a per-piece or per-campaign basis.
Putting a Price Tag on Conversions
Okay, you’ve got your costs. Now you have to connect your content to actual revenue. This is where attribution models come in. Think of an attribution model as the set of rules you use to give credit for a sale to the different marketing touchpoints a customer interacted with along the way.
- First-Touch Attribution: This model gives 100% of the credit to the very first piece of content a customer ever saw. It’s perfect for figuring out what content is best at bringing new people into your world.
- Last-Touch Attribution: The complete opposite. This gives all the credit to the final touchpoint before a conversion. It's great for identifying the content that seals the deal.
- Multi-Touch Attribution: This is where things get more sophisticated, distributing credit across multiple interactions. A Linear model gives equal credit to every touchpoint, while a Time-Decay model gives more weight to the interactions that happened closer to the sale. Multi-touch is often the most accurate, but it does require more advanced analytics tools.
So, which one is right? It really depends on your sales cycle. If you have a short, simple buying process, last-touch might be all you need. But for a long, complex B2B sales journey, a multi-touch model will give you a much more realistic view.
From Leads to Lifetime Value
Attributing a conversion is just the first step. The next, and most important, is knowing what that conversion is actually worth. To turn your leads into cold, hard revenue figures, you need to calculate two key metrics.
- Average Lead Value (ALV): This tells you what a single lead is worth on average. The math is simple: divide your total sales revenue from a period by the number of leads you generated in that same period. If you made $100,000 from 200 leads, your ALV is $500.
- Customer Lifetime Value (LTV): This is the holy grail. It’s the total revenue you can reasonably expect to get from a single customer over the entire time they do business with you. LTV is critical because it captures the impact of repeat purchases and long-term loyalty—two things that great content is fantastic at building.
Focusing on LTV stops you from undervaluing your top-of-funnel content. That blog post might not have driven an immediate sale, but if it created a loyal customer who spends thousands over several years, its value is immense.
Once you have your true costs and a revenue figure tied to ALV or LTV, you’re no longer working with flimsy data. You have solid numbers you can use to build a defensible ROI calculation.
How to Compute and Interpret Your Content ROI
Okay, you’ve done the hard work of tracking your costs and tying revenue back to specific content. Now for the payoff. It’s time to bring it all together and figure out the actual return on your investment. This is where all that detailed setup gives you a number you can confidently take to your boss.
https://www.youtube.com/embed/O-wq-C-52NY
The classic formula for measuring content marketing ROI is beautifully simple:
(Net Profit / Total Investment) x 100% = Content ROI
Let’s walk through a real-world example. Say you spent $5,000 creating and promoting a big, comprehensive guide. Because you have your CRM and attribution set up, you can see that leads who downloaded that guide have generated $20,000 in new business.
Your net profit here is $15,000 (that’s the $20,000 in revenue minus your $5,000 cost).
Plugging that into the formula:
- ($15,000 / $5,000) x 100% = 300% ROI
A 300% ROI is a fantastic result. It’s a clean, simple metric that shows for every dollar you put in, you got that dollar back plus three more. This is how you prove your content isn't just a cost center—it's a revenue driver.
Don't Stop at Just One Number
Calculating a single, overall ROI is a great starting point, but the real magic happens when you get more granular. A blended ROI can easily hide what’s really working and what’s dragging your average down. To make truly smart decisions, you need to slice up the data.
The goal is to move from a general "how are we doing?" to specific, actionable intelligence. You can do this by segmenting your ROI calculations to answer much more interesting questions.
- ROI by Channel: Is the content we share on LinkedIn actually performing better than our email newsletter?
- ROI by Format: Are our video tutorials bringing in more valuable customers than our blog posts?
- ROI by Campaign: How did our Q3 product launch campaign stack up against the Q2 brand awareness push?
This is where you'll find your edge. You might discover that while your blog gets tons of traffic, the people who listen to your podcast end up converting into high-value customers at double the rate. That's an insight you can build a whole strategy around.
By isolating variables, you stop treating all content as equal. You start investing your time, money, and creative energy with precision, building a roadmap for what to do next.
Turning Your Results Into Smarter Decisions
Once you have these segmented ROI figures, the final step is to figure out what they mean. Data is useless unless you can translate it into a clear story that guides your next move. What are the numbers actually telling you?
This isn't just about finding winners and losers. It's about understanding why something is working so well. For instance, you might see that video content delivers ROI 49% faster than articles. But digging deeper, you could find that short-form video is the real powerhouse, with 71% of marketers calling it their top ROI driver. This kind of specific insight, often highlighted in industry reports, can help you pivot your strategy for much faster returns. If you're curious about the latest trends, you can discover additional content marketing statistics that might inform your own analysis.
Here’s how to turn those findings into a concrete game plan:
- Double Down on Winners: If your case studies are showing a 450% ROI, it's time to make more of them. Simple as that.
- Fix or Cut the Losers: Are your webinars barely breaking even? Figure out why. Is the topic wrong? Is the promotion weak? Or is it maybe time to ditch that format and reinvest the resources elsewhere?
- Inform Your Future Content: Let the data guide your editorial calendar. If "how-to" guides consistently outperform your high-level thought leadership pieces, you know you need to prioritize more practical, instructional content.
This cycle—calculate, segment, interpret, and act—is the engine that powers a high-performing content program. For a broader look at this topic, our guide on how to measure marketing effectiveness provides some extra context.
Using Dashboards to Drive Smarter Content Decisions
All the tracking and number-crunching in the world is useless if the data just sits in a spreadsheet. Raw numbers are noise; a well-built dashboard is what turns that noise into a clear signal, telling you exactly what’s working and what isn’t. This is where your data becomes a strategic roadmap for your content.
The whole point is to create one central place that visualizes how your content is performing against actual business goals. This isn't just about making pretty charts for a report. It's about building a powerful feedback loop: data informs your content strategy, and your smarter strategy generates even better results.
Tools like Google Looker Studio are perfect for this. They can pull data from all over the place—Google Analytics, your CRM, spreadsheets—and bring it all together in one interactive view.
Designing Your Content ROI Dashboard
A great dashboard tells a story at a glance. You should be able to look at it and immediately understand what's going on, without having to hunt through rows of data. When you're building yours, always prioritize clarity and actionability.
Start by thinking about the questions you need answered most urgently:
- Which blog posts are actually bringing in qualified leads?
- Are we getting a better return from LinkedIn or from organic search?
- Are we on pace to hit our quarterly goal for demo requests?
- How do our top-of-funnel articles help with bottom-of-funnel conversions?
Every single chart on your dashboard should exist to answer one of these questions. Resist the temptation to cram it full of vanity metrics. If a number doesn't help you make a decision, it's just clutter.

This kind of visualization helps you immediately spot trends in where your users are coming from and what they're doing, connecting the big-picture metrics to specific channels.
Key Metrics to Visualize
Your dashboard should give you a layered view of performance, connecting high-level business impact right down to the specific content that's driving it. To really understand how you're measuring content marketing ROI, make sure you include these components.
High-Level Business Impact These are your North Star metrics. Put them front and center so anyone can see the ultimate contribution your content is making.
- Total Revenue Attributed to Content: The bottom-line dollar amount your content has generated.
- Content-Sourced Leads: How many new leads started their journey by engaging with your content.
- Overall Content ROI (%): The big one. Your total return on investment, shown as a clear percentage.
Lead Generation and Conversion Metrics This is where you connect your content to what's happening in the sales pipeline. It shows you which assets are actually moving people down the funnel.
- Leads by Content Asset: A simple bar chart showing which specific posts, guides, or webinars are the real lead magnets.
- Conversion Rate by Channel: A side-by-side look at how traffic from organic search, social media, or email is converting into leads.
- Cost Per Lead (CPL): The average amount of money you have to spend to get one lead from your content efforts.
A dashboard isn’t a static report; it’s a living tool. My personal rule is to review our content ROI dashboard weekly. It’s a 15-minute check-in that keeps the team aligned and helps us spot opportunities or problems before they get out of hand.
Turning Insights Into Action
Once your dashboard is up and running, you can finally operate like a data-informed content strategist. The process becomes a simple, repeatable loop: analyze, identify, and act.
Spotting Your Winners Look for the outliers—the articles or videos that are crushing it compared to everything else. Is one particular blog post driving 40% of your demo requests? You've found a winner.
When you find one, your action plan is straightforward:
- Promote it harder: Put some ad budget behind it on LinkedIn or other key channels.
- Repurpose it: Can you turn the core ideas into a video, an infographic, or a short webinar?
- Create more like it: Figure out why it works. Analyze its topic, format, and angle, and then build similar content into your editorial calendar.
Identifying Underperformers It’s just as important to find the content that's not pulling its weight. Did you spend $2,000 on an ebook that’s only brought in five leads in three months? That’s a dud.
For these underperforming assets, you have a few options:
- Update and Relaunch: Is the information out of date? Refresh it with new stats and insights, then promote it as a new-and-improved resource.
- Optimize the CTA: Sometimes the content is great, but the call-to-action is weak. Try testing a more specific or compelling offer.
- Change the Strategy: Maybe the content itself is solid, but it's being pushed to the wrong audience or on the wrong channel.
This constant cycle of analysis and optimization is what separates a good content program from a great one. It ensures your time and money are always flowing toward the activities that produce the highest possible return, turning your content marketing into a predictable growth engine.
Answering the Tough Questions About Content ROI
Even with a solid system in place, measuring content marketing ROI isn't always straightforward. A few common questions always seem to surface once you start digging into the data. Let's tackle them head-on, because getting these answers right can make all the difference.
How Long Does It Actually Take to See a Positive ROI?
This is the big one, isn't it? The honest, no-fluff answer is: it takes time. Content marketing is a long game. While you might see a quick bump from a paid ad, foundational content like SEO-focused blog posts needs a good 6 to 12 months to really start cooking and deliver a meaningful return.
Patience is your best friend here. While you wait for the big revenue numbers to roll in, keep your eyes on the leading indicators. Are you seeing more organic traffic? Are your keyword rankings climbing? Are more people signing up for your newsletter? These are the early signs that prove your strategy is on the right path, long before the dollars can be directly tied back.
What’s the "Best" Attribution Model to Use?
There's no magic bullet here. The "best" model is the one that actually fits your business and how your customers buy.
- For short sales cycles: If someone sees your content and buys within a few days, a Last-Touch model is often perfectly fine. It’s simple—it gives all the credit to the very last thing they clicked on before converting.
- For long B2B sales cycles: When a deal takes months and involves a whole committee, you need a Multi-Touch model (like linear or time-decay). This gives you a far more realistic view by recognizing that the blog posts, webinars, and case studies they engaged with all played a part.
My advice? Start simple. Get a last-touch model working first. It’s far better to have a simple system that gives you useful, directional data than to chase a "perfect" model that's too complex to even implement properly.
The biggest mistake I see is teams trying to build a flawless, multi-touch attribution model from scratch. Get the basics right first. You can always get more sophisticated later.
How Can I Possibly Measure the ROI of Top-of-Funnel Content?
This is a classic challenge. Your top-of-funnel (ToFu) content, like a blog post explaining a common problem, is rarely going to be the thing that closes a deal. So, how do you prove its worth?
You have to shift your focus from direct revenue to its two primary jobs: building an audience and helping with later conversions.
Track the leading indicators: growth in organic traffic, new visitors, backlinks you've earned, and an increase in people searching for your brand name. But the real gold is in your analytics platform's assisted conversions report. This will show you exactly how many times a "fluffy" ToFu article was a stop on a customer's journey that eventually led to a sale. It proves that this content is essential for filling the top of your funnel and teeing up future revenue.
Ready to turn your LinkedIn content into measurable leads and booked meetings? Unibox centralizes your outreach, automates follow-ups, and helps you focus on conversations that drive revenue. Start your free 14-day trial and see the difference at https://tryunibox.com.